
Eared Grebe Surveys on Mono Lake
By Sean Boyd, Pacific
Wildlife Research Centre, Canadian Wildlife Service;
the California Department of Fish and Game, and the Mono Lake Committee
Please contact the Mono Lake Committee and Dr. W.S. Boyd for written consent if you wish to use these data. Do not publish without written consent.
Article: The importance of Mono Lake and Great Salt Lake to eared grebes nesting in British Columbia
Photographic protocol to count grebes: Colonial Waterbirds 21 (2): 236-241, 1998... "Estimating the abundance of eared grebes on Mono Lake, CA, by aerial photography"
| Year | mid-Sep | Sep-Oct | mid-Oct | Oct-Nov | mid-Nov | Peak +15% (millions) | Comment |
| 2014 | 1.012 | .725 | .322 | .075 | .057 | 1.2 | Articles: on counts, results. |
| 2013 | .991 | 1.056 | 1.170 | .819 | .537 | 1.3 | Articles: on beginning multiple counts and 2013 protocols. |
| 2012 | 1.006 | 1.2 | Articles on count and on results. | ||||
| 2011 | .886 | 1.0 | Articles on count and on results. 11/14 rescues. 11/25 mortality count. | ||||
| 2010 | .514 | .59 | Article on results. | ||||
| 2009 | .530 | .61 | |||||
| 2008 | .226 | .26 | grebes may have departed sooner than normal resulting in the count missing the peak | ||||
| 2007 | no count | ||||||
| 2006 | no count | ||||||
| 2005 | .937 | 1.1 | count results | ||||
| 2004 | .665 | .77 | |||||
| 2003 | no count | ||||||
| 2002 | no count | ||||||
| 2001 | 1.242 | 1.4 | |||||
| 2000 | 1.583 | 1.8 | |||||
| 1999 | 1.106 | 1.3 | |||||
| 1998 | 0.861 | .90 | post el nino year | ||||
| 1997 | 1.646 | 1.8 | |||||
| 1996 | 1.480 | 1.7 |
All the above counts can be increased by 15-20% to account for submerged birds (see +15% column).
2014
EAGR totals rounded off to the nearest 1,000 birds:
- 15 Sep: 1,012,000 +/- 6.9% SE
- 30 Sep: 725,000 +/- 7.0 % SE
- 17 Oct: 322,000 +/- 8.8% SE
- 28 Oct: 75,000 +/- 10.3% SE
- 10 Nov: 57,000 +/- 12.5% SE
2013
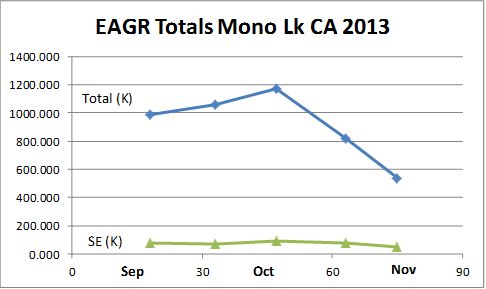
Here are the totals for the EAGR counts by date for 2013. I haven’t done the stats yet but it appears that the total number of birds on the surface increased slightly from mid-Sep to mid-Oct and then declined fairly rapidly from mid-Oct to mid-Nov. I still question the accuracy of the scale data so the numbers should be treated with caution. Also, the actual (real) number of grebes on the lake could differ depending on the proportion of birds submerged during each survey (which changes over the fall period). If these data are close to being accurate then the rapid decrease in numbers from mid-Oct to early Nov is of concern. We need to chat about how to resolve the scale issue and potential dates for the 2014 surveys. Please forward this email as appropriate. Cheers. Sean
Date |
Julian |
Total #(K) |
%SE |
SE |
|||
18-Sep-13 |
18 |
990.681 |
7.8 |
77.273 |
|||
02-Oct-13 |
33 |
1055.874 |
6.8 |
71.799 |
|||
16-Oct-13 |
47 |
1169.826 |
8.1 |
94.756 |
|||
01-Nov-13 |
63 |
818.949 |
9.9 |
81.076 |
|||
13-Nov-13 |
75 |
536.864 |
8.7 |
46.707 |
|||
|
2012
The final count for October 13, 2012 was
1,006,127 +/- about 10–11% Standard Error; more than counted in 2011.
2011
The final count for October 14, 2011 was 886,500 +/-4.4% Standard Error.
2010
The total number of birds on on 13 Oct 2010 was ca. 514,000 birds +/- 7.6% SE, so slightly fewer than last year. Proposal submitted to Environment Canada's avian monitoring committee to finance the Mono Lk counts on an annual basis.
2009
17 Oct 2009 count was 530,000 birds (+/- 8% SE). Conditions were not optimal but Sean feels the count is representative of the population of grebes on the lake at the time.
2008
Starting this year, flights by Lighthawk and photography with volunteers coordinated by the Mono Lake Committee and counts and analysis continue by Sean Boyd. October 16, 2008
count was the lowest recorded to date, probably somewhere between 200-300K, or 10-15% of the maximum number recorded by photo counts in the mid-late 1990s (7% SE). That may have to do with changes to the shrimp population dynamics/timing, I don't know. I have always said that the mid-October count is a good index but its value is subject to knowing how consistent the movement patterns of EAGRs through ML are each year. How consistent is the proportion of the peak number every mid-October? What is the turnover rate of birds moving through ML and how consistent is that year after year? The only way to know that is to conduct regular photo surveys (say every 2 weeks), mark birds with VHFs on breeding colonies and track those birds at ML, and repeat this over at least 3 consecutive years. The photo counts and VHF tracking are possible since I did both in the 1990s, but this would take a lot of $. Sean
2007
No count since DFG decided not to do surveys.
2006
No count due to grebes leaving in early October and the Department of
Fish and Game plane in Sacramento getting its windshield replaced.
2005
Here are the results of the EAGR photo count conducted on Mono
Lake in mid-October 2005:
Total = 936,617
%SE = 4.7%
N = 655 photos
This is a fairly large increase over the previous year, mid-October
2004:
Total = 665,335
%SE = 6.8%
N = 310 photos
Ron VanBenthuysen of Cal DFG conducted the photo count and he more than doubled the number of photos taken over last year. Although not really needed this year because the birds were fairly evenly distributed, the larger sample size will help reduce the variance in years when grebes are highly clumped. For this data set, I generated total estimates using every 2nd, 3rd, and 4th photos and found that, while the totals varied by up to 50,000 birds over the baseline number above, the %SE increased to ca. 7%, 8.5% and 10%, respectively.
Also, using Ron�s PhotoLink setup I was able to correct density values for altitude variability, and this made a difference of about 70,000 birds over the uncorrected total.
I think the protocol we now have established for Mono Lake is a good one. Thanks to Ron, Esther, Melanie, Dan and others at Cal DFG for making the arrangements and conducting the survey. Also thanks to Greg Reis for supplying data to calculate the surface area of Mono Lake.
2004
I just finished counting the pics and doing the math and arrived
at a total count of 665,300 (surface) grebes +/- 6.8% (S.E.) (n = 310
pics). This count is quite a bit lower than most of the mid-October
counts I did in the 1990s.
Digital photos were used for the first time this year by Cal DFG which is definitely the way to go. We are in the process of developing an even better protocol for next year to improve coverage and reduce variance.
Thanks to Ron VanBenthuysen, Dan Yparraguire, and Melanie Weaver of Cal DFG for setting up and conducting the aerial survey and Peter Vorster, Gregory Reis and Geoff McQuilkin for supplying info on how to calculate lake surface area.
Cal State Dept Fish and Game have graciously agreed to do the counts. After a couple of attempts they were successful at doing a good digital survey in fall 2004 (see some correspondence below). The agreement is that Sean will count the birds on the pictures, calculate a mean density and then figure out the total number of grebes on the lake. Below is some discussion of the protocols:
1. Unfortunately, the camera we used in 2004 is different from the camera we used last time. It's much better but 105mm is the longest focal length we have for it right now. I agree that a higher altitude with a longer focal length would be better. I think we need to get a new lens to do that though.
2. There were still diving/splashing birds on some photos so it's possible that the dual engine aircraft is still a problem at 1200 ft (I used a single engine aircraft). So, I suggest next year to do the surveys at 1500 ft altitude above water level and use a longer lens (but, again, try to achieve a scale result of 150 m from top to bottom).
3. I noticed sun reflection on some photos, making it difficult to count birds in some cases. This can occur if there is a slight wind on the water and the survey is conducted when the sun is high. I found that doing the survey between 0900-1100 h is best to avoid this situation (between 0830-1030 h is even better)... the sun is lower and there is usually less wind. So, if possible, it would be best to do the survey earlier if your schedule allows.
4. You took about 350 pics whereas I usually took 450 - 500 photos during each survey and found that this kept the variance down to a minimum. Of course, the more photos the better for both accuracy and variance so you might want to increase the number of pics taken over water to at least 500.
If it's not a problem then I suggest flying more transects and taking more photos per transect (I flew 16 total transects over the water; 8 E-W transects going from south to north followed by another 8 going north to south but offset so that the transects evenly covered the entire lake) so that you end up with about 500 photos total taken over the water.